Introduction –
Bacterial Growth is defined as increase in cell size and number. The bacteria increase its number by reproducing asexual methods such binary fission, budding, multiple fission or by producing spores. For binary fission reproduction, bacteria needs to replicate its genetic material and enlarge its size by expanding cell membrane and cell wall. The replicated genetic material is segregated and the septum is formed and dividing the cells into two half. The sequential steps that are occurs in bacterial life is called cell cycle. The duration of cell cycle varies from bacterial species to species. The E.coli multiplies in 20 minutes.
Growing Bacteria in Laboratory
To grow bacteria in laboratory or artificial environment we provide required nutrients and favorable physical environment to the bacteria. The motive for growing bacteria is to conduct its Biochemical, molecular and pathogenesis studies. The application of such studies is to obtain fundamental knowledge of bacteria (how do they grow, How do they multiply, What do they need, What do they produce etc) and further to use bacteria for producing different products like hormones, antibiotics, secondary metabolites and vaccines etc). To conduct fundamental studies or to produce biological important products, it is crucial to keep an eye on the increase or decrease in the number of bacteria and the factors that affect their multiplication.
Such quantitative study can be calculated by plotting Bacterial growth curve.
Plotting Bacterial growth curve
To plot the graph, we need to observe and note the increase or decrease in bacterial population with respect to time. Hence, on the bacterial growth curve, X axis represents time and Y axis represents change in bacterial population. Batch Culture or Closed system is the basic requirement for conducting bacterial growth curve experiment. In closed system or batch culture, after providing the nutrients once there is no further addition of nutrients to the system. The best example of closed system is conical flask filled with inoculated desired bacteria in sterile nutrient media. When bacteria are growing and multiplying in such a closed system, there is accumulation of waste material (excreted by bacteria).
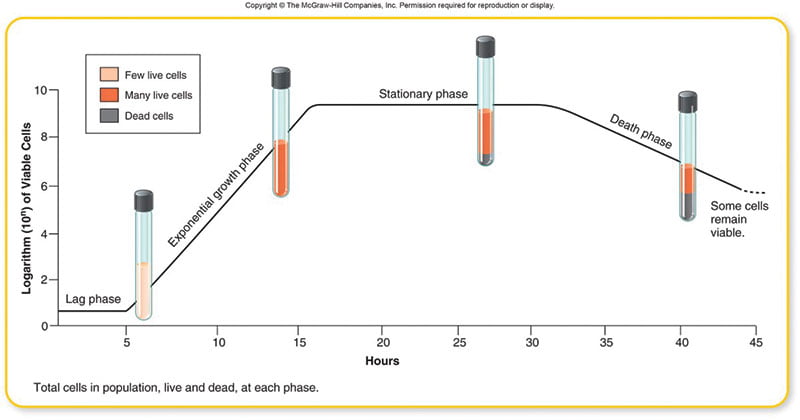
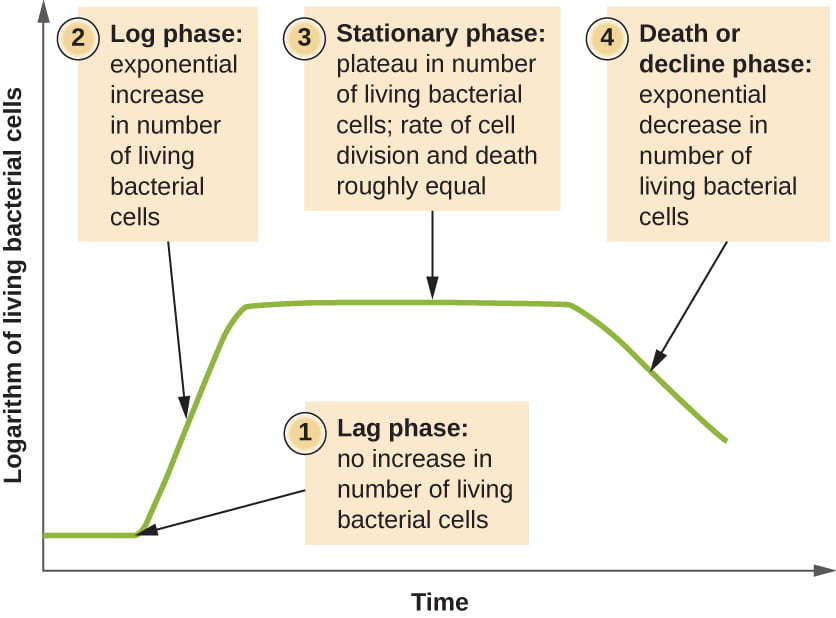
The closed system does not provide any facility for removing the waste. Based on the availability of nutrients and accumulation of waste or toxins, the bacteria shows a pattern of growth. When microorganisms are grown in a closed system or batch culture, the resulting growth curve usually has four phases: – the lag, exponential or log, stationary, and death phases.
As mentioned earlier, Growth can be defined as increase in number or size. If the microorganism is coenocytic—that is, a multinucleate organism in which nuclear divisions are not accompanied by cell divisions then such growth results in an increase in cell size but not cell number.
Phases of Bacterial Growth –
Lag Phase
- When microorganism is introduced or inoculated in the fresh culture medium, no sudden increase in cell number is observed, this period is called as lag phase.
- The lag phase is the time which is used by the bacteria to get adapted to the newly provided nutrients and physical environment hence, it can called as adaptation period.
- In lag phase, the bacteria do not multiply but it prepares itself for the division.
- The bacteria invest this time in preparing the necessary and essential factors, ribosome, proteins and enzymes that are required for conducting important physiological and molecular processes.
- In the same time period, the bacteria increase its size and also prepare itself for the division or multiplication.
- The length of lag phase depends on nutrients, physical environment and bacterial cell’ condition.
- When active cell is inoculated in closed system or batch culture, the length of lag phase is shorter than the dormant, inactive or damaged bacteria.
Exponential / Log Phase –
- In this phase microorganisms divide at the maximum rate by giving their most in the genetic potential, the nature of the medium, and the conditions under which they are growing.
- When bacteria multiplies via binary fission, one bacteria produces two daughter cells. Total number of population can be derived by 2n, where n is the number of time bacteria has multiplied or number of generation.
- The growth is constant as the microorganism divide at regular interval this makes the growth cure smooth rather than discrete jumps.
- The exponential phase culture is used by the scientists for the studies.
- The exponential growth is a balance growth which means that cellular constituents are manufactured at constant rates.
- If the concentration of nutrients changes, it may lead to unbalanced growth.
- This could be demonstrable when one inoculates the microbe from nutritionally poor medium to rich medium or vice versa.
- This causes shift up or down in the graph.
- Hence, the increase in cell number is directly proportional to nutrient concentration.
Stationary Phase –
- The log phase is followed by stationary phase.
- It looks like plateau in the growth curve graph.
- It depicts that the rate of division is equal to the rate of cell death.
- In Batch culture, the stationary phase usually is attained by bacteria at a population level of around 109 cells per ml.
- The final population density or size will depend on the availability of the nutrients in the culture medium as well as the type of microorganism.
- The stationary phase can be caused by various reasons; few of the most important is lack of the nutrients and accumulation of toxins.
- For aerobic microbes, lack of proper aeration could also be the reason.
- Such lack of nutrients (starvation) or unfavorable environment can induce endospore formation.
- The endospore forming bacteria start producing starvation proteins and enter in the endospore formation pathway.
- Such endospore becomes resistant to physical or environmental stress.
- Scientific evidence has shown that Salmonella thyphimurium and some other bacterial pathogens become more virulent when starved.
Death Phase:
- In Death phase the rate of death is more than rate of division. Hence, there is decline in the bacterial population
- The reason for death of cells is the consumption of provided nutrients and accumulation of toxic materials.
- As the time passes, nutrients become extinct and more and more toxins get accumulated.
- This causes increase in death rate than division rate due to which the graphs shows exponential decrease in cell number, this is inverse to log phase.
- The length of death phase varies from bacterial species to species.
Application of studying Bacterial Growth curve-
The bacteria are grown in lab in order to conduct fundamental research and for producing desired products. The bacterial growth curve has following applications:
- To study nutritional and physical need for bacterial growth.
- To study biochemical and molecular pathways of bacteria.
- To produce desired bacterial products, Industries need to grow bacteria exponentially.
- For antibiotic production, because the bacteria mostly produces antibiotics in stationary phase.
References –
http://www2.hawaii.edu/~johnb/micro/medmicro/medmicro.5.html